Figure 1
The importance of gestational age in first trimester, maternal urine MALDI-Tof MS screening tests for Down Syndrome
Ray K Iles*, Nicolaides K, Pais RJ, Zmuidinaite R, Keshavarz S, Poon LCY and Butler SA
Published: 31 December, 2019 | Volume 3 - Issue 1 | Pages: 010-017
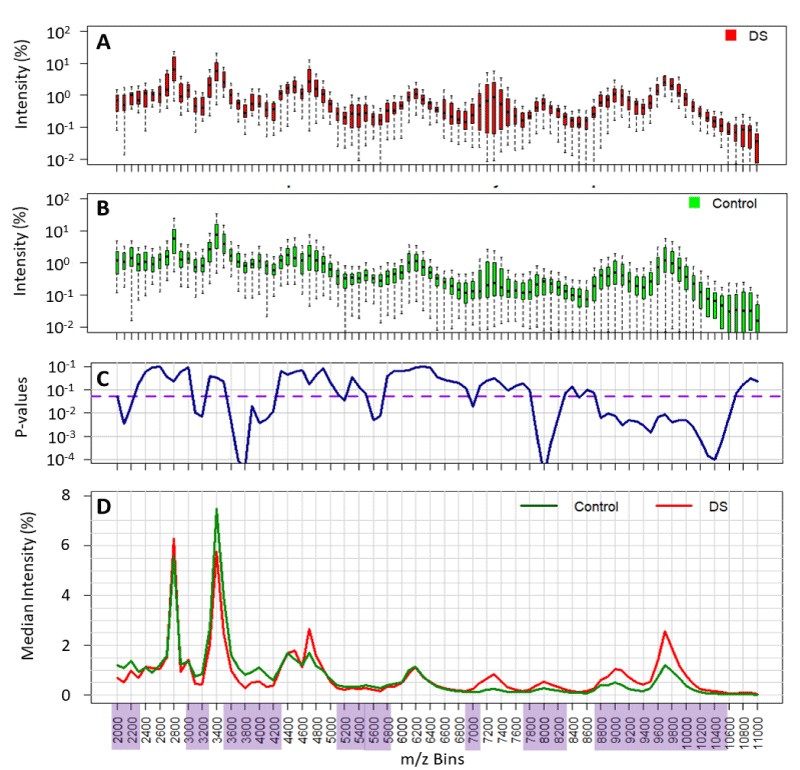
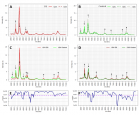
Figure 1:
Comparison of the variability of normalised spectral value at each mass bin and its statistical difference between all Downs/T21 (DS) and non-aneuploid pregnancy urine spectra (control). Variability of data is shown in the boxplots (panel A and B). p - values of statistical differences shown in panel C. Threshold of significance (p - values < 0.05) are depicted in the purple dashed line and the significant mass bins highlighted in purple. Comparison of population medians highlighted in panel D.
Read Full Article HTML DOI: 10.29328/journal.apb.1001008 Cite this Article Read Full Article PDF
More Images
Similar Articles
-
The importance of gestational age in first trimester, maternal urine MALDI-Tof MS screening tests for Down SyndromeRay K Iles*,Nicolaides K,Pais RJ,Zmuidinaite R,Keshavarz S,Poon LCY,Butler SA. The importance of gestational age in first trimester, maternal urine MALDI-Tof MS screening tests for Down Syndrome. . 2019 doi: 10.29328/journal.apb.1001008; 3: 010-017
Recently Viewed
-
Sinonasal Myxoma Extending into the Orbit in a 4-Year Old: A Case PresentationJulian A Purrinos*, Ramzi Younis. Sinonasal Myxoma Extending into the Orbit in a 4-Year Old: A Case Presentation. Arch Case Rep. 2024: doi: 10.29328/journal.acr.1001099; 8: 075-077
-
Sex after Neurosurgery–Limitations, Recommendations, and the Impact on Patient’s Well-beingMor Levi Rivka*, Csaba L Dégi. Sex after Neurosurgery–Limitations, Recommendations, and the Impact on Patient’s Well-being. J Neurosci Neurol Disord. 2024: doi: 10.29328/journal.jnnd.1001099; 8: 064-068
-
The effect of NLP-based approach to teaching surgical procedures to senior OBGYN residentsMitra Ahmad Soltani,Jamileh Jahanbakhsh*,Zahra Takhty,Azarmindokht Shojai,Hengameh Sheikh. The effect of NLP-based approach to teaching surgical procedures to senior OBGYN residents. Clin J Obstet Gynecol. 2021: doi: 10.29328/journal.cjog.1001075; 4: 001-002
-
Unilateral pleural effusion as the sole presentation of ovarian hyperstimulation syndrome (OHSS)Tarique Salman*,Suruchi Mohan,Yasmin Sana. Unilateral pleural effusion as the sole presentation of ovarian hyperstimulation syndrome (OHSS). Clin J Obstet Gynecol. 2020: doi: 10.29328/journal.cjog.1001074; 3: 182-184
-
Chronic endometritis in in vitro fertilization failure patientsAfaf T Elnashar*,Mohamed Sabry. Chronic endometritis in in vitro fertilization failure patients. Clin J Obstet Gynecol. 2020: doi: 10.29328/journal.cjog.1001073; 3: 175-181
Most Viewed
-
Evaluation of Biostimulants Based on Recovered Protein Hydrolysates from Animal By-products as Plant Growth EnhancersH Pérez-Aguilar*, M Lacruz-Asaro, F Arán-Ais. Evaluation of Biostimulants Based on Recovered Protein Hydrolysates from Animal By-products as Plant Growth Enhancers. J Plant Sci Phytopathol. 2023 doi: 10.29328/journal.jpsp.1001104; 7: 042-047
-
Sinonasal Myxoma Extending into the Orbit in a 4-Year Old: A Case PresentationJulian A Purrinos*, Ramzi Younis. Sinonasal Myxoma Extending into the Orbit in a 4-Year Old: A Case Presentation. Arch Case Rep. 2024 doi: 10.29328/journal.acr.1001099; 8: 075-077
-
Feasibility study of magnetic sensing for detecting single-neuron action potentialsDenis Tonini,Kai Wu,Renata Saha,Jian-Ping Wang*. Feasibility study of magnetic sensing for detecting single-neuron action potentials. Ann Biomed Sci Eng. 2022 doi: 10.29328/journal.abse.1001018; 6: 019-029
-
Pediatric Dysgerminoma: Unveiling a Rare Ovarian TumorFaten Limaiem*, Khalil Saffar, Ahmed Halouani. Pediatric Dysgerminoma: Unveiling a Rare Ovarian Tumor. Arch Case Rep. 2024 doi: 10.29328/journal.acr.1001087; 8: 010-013
-
Physical activity can change the physiological and psychological circumstances during COVID-19 pandemic: A narrative reviewKhashayar Maroufi*. Physical activity can change the physiological and psychological circumstances during COVID-19 pandemic: A narrative review. J Sports Med Ther. 2021 doi: 10.29328/journal.jsmt.1001051; 6: 001-007

HSPI: We're glad you're here. Please click "create a new Query" if you are a new visitor to our website and need further information from us.
If you are already a member of our network and need to keep track of any developments regarding a question you have already submitted, click "take me to my Query."


