Figure 1
Prediction of protein Post-Translational Modification sites: An overview
Md. Mehedi Hasan* and Mst. Shamima Khatun
Published: 02 March, 2018 | Volume 2 - Issue 1 | Pages: 049-057
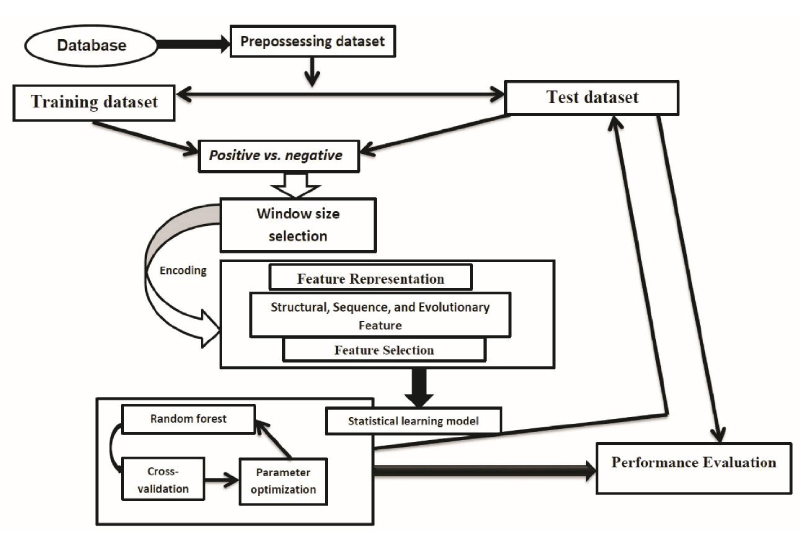
Figure 1:
A brief flowchart template for computational prediction PTM sites. Firstly, the dataset was collected from the published database. Secondly, then need to be preprocessed the collected datasets for making proper positive and negative samples. Thirdly, the resulting encoded feature vectors were independently put into the statistical learning models to produce independent prediction scores. Finally, optimum performance scores were calculated by using cross-validation and parameter optimization, a confident cutoff was considered to identify the PTM site.
Read Full Article HTML DOI: 10.29328/journal.apb.1001005 Cite this Article Read Full Article PDF
More Images
Similar Articles
-
Function Prediction of Proteins from their Sequences with BAR 3.0Giuseppe Profiti,Pier Luigi Martelli,Rita Casadio*. Function Prediction of Proteins from their Sequences with BAR 3.0. . 2017 doi: 10.29328/journal.hpbr.1001001; 1: 001-005
-
Microarray Analysis of Fish Genomic Data for enhancing Aquaculture Productivity of IndiaAjit Kumar Roy*. Microarray Analysis of Fish Genomic Data for enhancing Aquaculture Productivity of India. . 2017 doi: 10.29328/journal.hpbr.1001002; 1: 006-017
-
In silico analysis and characterization of fresh water fish ATPases and homology modellingRumpi Ghosh,AD Upadhayay,AK Roy*. In silico analysis and characterization of fresh water fish ATPases and homology modelling. . 2017 doi: 10.29328/journal.hpbr.1001003; 1: 018-024
-
The bio-energy transport in the protein molecules and its experimental validations of correctnessPang Xiao-Feng*. The bio-energy transport in the protein molecules and its experimental validations of correctness. . 2018 doi: 10.29328/journal.apb.1001004; 2: 001-048
-
Prediction of protein Post-Translational Modification sites: An overviewMd. Mehedi Hasan*,Mst. Shamima Khatun. Prediction of protein Post-Translational Modification sites: An overview. . 2018 doi: 10.29328/journal.apb.1001005; 2: 049-057
-
The properties of nonlinear excitations and verification of validity of theory of energy transport in the protein moleculesPang Xiao-Feng*. The properties of nonlinear excitations and verification of validity of theory of energy transport in the protein molecules. . 2018 doi: 10.29328/journal.apb.1001006; 2: 058-108
-
Theoretical study on binding interactions of laccase-enzyme from Ganoderma weberianum with multiples ligand substrates with environmental impactYosberto Cárdenas-Moreno*,Luis Ariel Espinosa,Julio Cesar Vieyto,Michael González-Durruthy,Alberto del Monte-Martinez,Gilda Guerra-Rivera,Maria Isabel Sánchez López. Theoretical study on binding interactions of laccase-enzyme from Ganoderma weberianum with multiples ligand substrates with environmental impact. . 2019 doi: 10.29328/journal.apb.1001007; 3: 001-009
-
The importance of gestational age in first trimester, maternal urine MALDI-Tof MS screening tests for Down SyndromeRay K Iles*,Nicolaides K,Pais RJ,Zmuidinaite R,Keshavarz S,Poon LCY,Butler SA. The importance of gestational age in first trimester, maternal urine MALDI-Tof MS screening tests for Down Syndrome. . 2019 doi: 10.29328/journal.apb.1001008; 3: 010-017
-
Classification of diseases using a hybrid fuzzy mutual information technique with binary bat algorithmFiras Ahmed Yonis AL-Taie*,Omar Saber Qasim . Classification of diseases using a hybrid fuzzy mutual information technique with binary bat algorithm. . 2020 doi: 10.29328/journal.apb.1001009; 4: 001-005
-
Improving cancer diseases classification using a hybrid filter and wrapper feature subset selectionNoor Muhammed Noori*,Omar Saber Qasim. Improving cancer diseases classification using a hybrid filter and wrapper feature subset selection. . 2020 doi: 10.29328/journal.apb.1001010; 4: 006-011
Recently Viewed
-
Obesity in Patients with Chronic Obstructive Pulmonary Disease as a Separate Clinical PhenotypeDaria A Prokonich*, Tatiana V Saprina, Ekaterina B Bukreeva. Obesity in Patients with Chronic Obstructive Pulmonary Disease as a Separate Clinical Phenotype. J Pulmonol Respir Res. 2024: doi: 10.29328/journal.jprr.1001060; 8: 053-055
-
Current Practices for Severe Alpha-1 Antitrypsin Deficiency Associated COPD and EmphysemaMJ Nicholson*, M Seigo. Current Practices for Severe Alpha-1 Antitrypsin Deficiency Associated COPD and Emphysema. J Pulmonol Respir Res. 2024: doi: 10.29328/journal.jprr.1001058; 8: 044-047
-
Navigating Neurodegenerative Disorders: A Comprehensive Review of Current and Emerging Therapies for Neurodegenerative DisordersShashikant Kharat*, Sanjana Mali*, Gayatri Korade, Rakhi Gaykar. Navigating Neurodegenerative Disorders: A Comprehensive Review of Current and Emerging Therapies for Neurodegenerative Disorders. J Neurosci Neurol Disord. 2024: doi: 10.29328/journal.jnnd.1001095; 8: 033-046
-
Metastatic Brain Melanoma: A Rare Case with Review of LiteratureNeha Singh,Gaurav Raj,Akshay Kumar,Deepak Kumar Singh,Shivansh Dixit,Kaustubh Gupta*. Metastatic Brain Melanoma: A Rare Case with Review of Literature. J Radiol Oncol. 2025: doi: 10.29328/journal.jro.1001080; 9: 050-053
-
Validation of Prognostic Scores for Attempted Vaginal Delivery in Scar UterusMouiman Soukaina*,Mourran Oumaima,Etber Amina,Zeraidi Najia,Slaoui Aziz,Baydada Aziz. Validation of Prognostic Scores for Attempted Vaginal Delivery in Scar Uterus. Clin J Obstet Gynecol. 2025: doi: 10.29328/journal.cjog.1001185; 8: 023-029
Most Viewed
-
Evaluation of Biostimulants Based on Recovered Protein Hydrolysates from Animal By-products as Plant Growth EnhancersH Pérez-Aguilar*, M Lacruz-Asaro, F Arán-Ais. Evaluation of Biostimulants Based on Recovered Protein Hydrolysates from Animal By-products as Plant Growth Enhancers. J Plant Sci Phytopathol. 2023 doi: 10.29328/journal.jpsp.1001104; 7: 042-047
-
Sinonasal Myxoma Extending into the Orbit in a 4-Year Old: A Case PresentationJulian A Purrinos*, Ramzi Younis. Sinonasal Myxoma Extending into the Orbit in a 4-Year Old: A Case Presentation. Arch Case Rep. 2024 doi: 10.29328/journal.acr.1001099; 8: 075-077
-
Feasibility study of magnetic sensing for detecting single-neuron action potentialsDenis Tonini,Kai Wu,Renata Saha,Jian-Ping Wang*. Feasibility study of magnetic sensing for detecting single-neuron action potentials. Ann Biomed Sci Eng. 2022 doi: 10.29328/journal.abse.1001018; 6: 019-029
-
Pediatric Dysgerminoma: Unveiling a Rare Ovarian TumorFaten Limaiem*, Khalil Saffar, Ahmed Halouani. Pediatric Dysgerminoma: Unveiling a Rare Ovarian Tumor. Arch Case Rep. 2024 doi: 10.29328/journal.acr.1001087; 8: 010-013
-
Physical activity can change the physiological and psychological circumstances during COVID-19 pandemic: A narrative reviewKhashayar Maroufi*. Physical activity can change the physiological and psychological circumstances during COVID-19 pandemic: A narrative review. J Sports Med Ther. 2021 doi: 10.29328/journal.jsmt.1001051; 6: 001-007

HSPI: We're glad you're here. Please click "create a new Query" if you are a new visitor to our website and need further information from us.
If you are already a member of our network and need to keep track of any developments regarding a question you have already submitted, click "take me to my Query."


