Figure 7
The bio-energy transport in the protein molecules and its experimental validations of correctness
Pang Xiao-Feng*
Published: 18 January, 2018 | Volume 2 - Issue 1 | Pages: 001-048
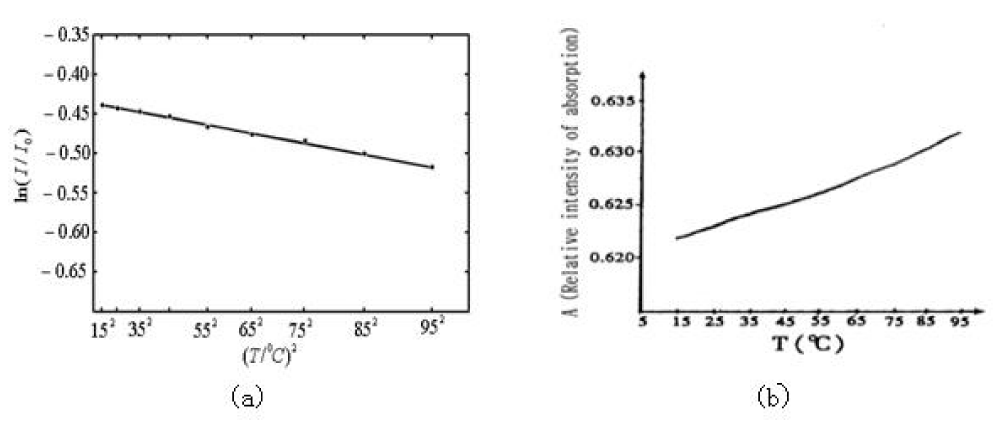
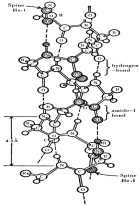
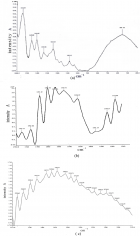
Figure 7:
The temperature-dependences of intensity of infrared absorption of collagen in the region of 15 – 950C. (a) is the relation of logarithm of relative intensity, Ln(I/I0), versus (T/0C)2 and corresponding experimental data denoted by “•” for the 1650cm-1 peak, where the solid line expresses Ln(I/I0)=(0.437+8.987×10-6(T/0C)2). (b) represents the linear temperature-dependence of the relative intensity I/I0 for the 1666cm-1 peak.
Read Full Article HTML DOI: 10.29328/journal.apb.1001004 Cite this Article Read Full Article PDF
More Images
Similar Articles
-
Function Prediction of Proteins from their Sequences with BAR 3.0Giuseppe Profiti,Pier Luigi Martelli,Rita Casadio*. Function Prediction of Proteins from their Sequences with BAR 3.0. . 2017 doi: 10.29328/journal.hpbr.1001001; 1: 001-005
-
In silico analysis and characterization of fresh water fish ATPases and homology modellingRumpi Ghosh,AD Upadhayay,AK Roy*. In silico analysis and characterization of fresh water fish ATPases and homology modelling. . 2017 doi: 10.29328/journal.hpbr.1001003; 1: 018-024
-
The bio-energy transport in the protein molecules and its experimental validations of correctnessPang Xiao-Feng*. The bio-energy transport in the protein molecules and its experimental validations of correctness. . 2018 doi: 10.29328/journal.apb.1001004; 2: 001-048
-
Prediction of protein Post-Translational Modification sites: An overviewMd. Mehedi Hasan*,Mst. Shamima Khatun. Prediction of protein Post-Translational Modification sites: An overview. . 2018 doi: 10.29328/journal.apb.1001005; 2: 049-057
-
The properties of nonlinear excitations and verification of validity of theory of energy transport in the protein moleculesPang Xiao-Feng*. The properties of nonlinear excitations and verification of validity of theory of energy transport in the protein molecules. . 2018 doi: 10.29328/journal.apb.1001006; 2: 058-108
-
In silico comparative analysis of HIV protease inhibitors effect on 2019-nCoV coronavirus 3CLproVandna Kumari,Shamsher Singh Kanwar*. In silico comparative analysis of HIV protease inhibitors effect on 2019-nCoV coronavirus 3CLpro. . 2020 doi: 10.29328/journal.apb.1001011; 4: 012-014
-
Pigeonpea sterility mosaic virus a green plague-Current status of available drug and new potential targetsNisha Singh*,Bhawna Narula,Megha Ujinwal,Sapna Langyan. Pigeonpea sterility mosaic virus a green plague-Current status of available drug and new potential targets. . 2021 doi: 10.29328/journal.apb.1001013; 5: 008-026
-
The SARS CoV-2 spike domain, RGD and integrin binding effect-relationship for vaccine design strategyLuisetto M*,Tarro G,Khaled Edbey,Almukthar N,Cabianca L,Mashori GR,Yesvi AR,Latyschev OY. The SARS CoV-2 spike domain, RGD and integrin binding effect-relationship for vaccine design strategy. . 2021 doi: 10.29328/journal.apb.1001014; 5: 027-041
-
In silico disrupting quorum sensing of porphyromonas gingivalis via essential oils and coumarin derivativesHaitham Ahmed Al-Madhagi*,Zaher Samman Tahan. In silico disrupting quorum sensing of porphyromonas gingivalis via essential oils and coumarin derivatives. . 2022 doi: 10.29328/journal.apb.1001017; 6: 001-005
Recently Viewed
-
Clinical and Histopathological Mismatch: A Case Report of Acral FibromyxomaMonica Mishra*,Kailas Mulsange,Gunvanti Rathod,Deepthi Konda. Clinical and Histopathological Mismatch: A Case Report of Acral Fibromyxoma. Arch Pathol Clin Res. 2025: doi: 10.29328/journal.apcr.1001045; 9: 005-007
-
Unconventional powder method is a useful technique to determine the latent fingerprint impressionsHarshita Niranjan,Shweta Rai,Kapil Raikwar,Chanchal Kamle,Rakesh Mia*. Unconventional powder method is a useful technique to determine the latent fingerprint impressions. J Forensic Sci Res. 2022: doi: 10.29328/journal.jfsr.1001035; 6: 045-048
-
Doppler Evaluation of Renal Vessels in Pediatric Patients with Relapse and Remission in Different Categories of Nephrotic SyndromeAmit Nandan Dhar Dwivedi*, Srishti Sharma, OP Mishra, Girish Singh. Doppler Evaluation of Renal Vessels in Pediatric Patients with Relapse and Remission in Different Categories of Nephrotic Syndrome. J Clini Nephrol. 2023: doi: 10.29328/journal.jcn.1001112; 7: 067-072
-
Atlantoaxial subluxation in the pediatric patient: Case series and literature reviewCatherine A Mazzola*,Catherine Christie,Isabel A Snee,Hamail Iqbal. Atlantoaxial subluxation in the pediatric patient: Case series and literature review. J Neurosci Neurol Disord. 2020: doi: 10.29328/journal.jnnd.1001037; 4: 069-074
-
Intelligent Design of Ecological Furniture in Risk Areas based on Artificial SimulationTorres del Salto Rommy Adelfa*, Bryan Alfonso Colorado Pástor*. Intelligent Design of Ecological Furniture in Risk Areas based on Artificial Simulation. Arch Surg Clin Res. 2024: doi: 10.29328/journal.ascr.1001083; 8: 062-068
Most Viewed
-
Evaluation of Biostimulants Based on Recovered Protein Hydrolysates from Animal By-products as Plant Growth EnhancersH Pérez-Aguilar*, M Lacruz-Asaro, F Arán-Ais. Evaluation of Biostimulants Based on Recovered Protein Hydrolysates from Animal By-products as Plant Growth Enhancers. J Plant Sci Phytopathol. 2023 doi: 10.29328/journal.jpsp.1001104; 7: 042-047
-
Sinonasal Myxoma Extending into the Orbit in a 4-Year Old: A Case PresentationJulian A Purrinos*, Ramzi Younis. Sinonasal Myxoma Extending into the Orbit in a 4-Year Old: A Case Presentation. Arch Case Rep. 2024 doi: 10.29328/journal.acr.1001099; 8: 075-077
-
Feasibility study of magnetic sensing for detecting single-neuron action potentialsDenis Tonini,Kai Wu,Renata Saha,Jian-Ping Wang*. Feasibility study of magnetic sensing for detecting single-neuron action potentials. Ann Biomed Sci Eng. 2022 doi: 10.29328/journal.abse.1001018; 6: 019-029
-
Pediatric Dysgerminoma: Unveiling a Rare Ovarian TumorFaten Limaiem*, Khalil Saffar, Ahmed Halouani. Pediatric Dysgerminoma: Unveiling a Rare Ovarian Tumor. Arch Case Rep. 2024 doi: 10.29328/journal.acr.1001087; 8: 010-013
-
Physical activity can change the physiological and psychological circumstances during COVID-19 pandemic: A narrative reviewKhashayar Maroufi*. Physical activity can change the physiological and psychological circumstances during COVID-19 pandemic: A narrative review. J Sports Med Ther. 2021 doi: 10.29328/journal.jsmt.1001051; 6: 001-007

HSPI: We're glad you're here. Please click "create a new Query" if you are a new visitor to our website and need further information from us.
If you are already a member of our network and need to keep track of any developments regarding a question you have already submitted, click "take me to my Query."


